Online fraud, also referred to as cyberscams, is increasingly becoming a cybersecurity problem that technical cybersecurity specialists are unable to effectively detect. Given the difficulty in the automatic detection of scams, the onus is often pushed back to humans to detect. Gamification and awareness campaigns are regularly researched and implemented in workplaces to prevent people from being tricked by scams, which may lead to identity theft or conning individuals out of money.
Honours and Masters project
Displaying 81 - 90 of 233 honours projects.
Primary supervisor: Raphaël C.-W. Phan
Using Adobe Photoshop to generate or edit images is old news, we don't need to edit using our hand and mouse, nor even a stylus pen. All we need to do is command the gen AI to do it.
Right now the AI literature is trending with many techniques that enable to generate or edit realistic pictures by simply describing them: let there be pictures.

Primary supervisor: Raphaël C.-W. Phan
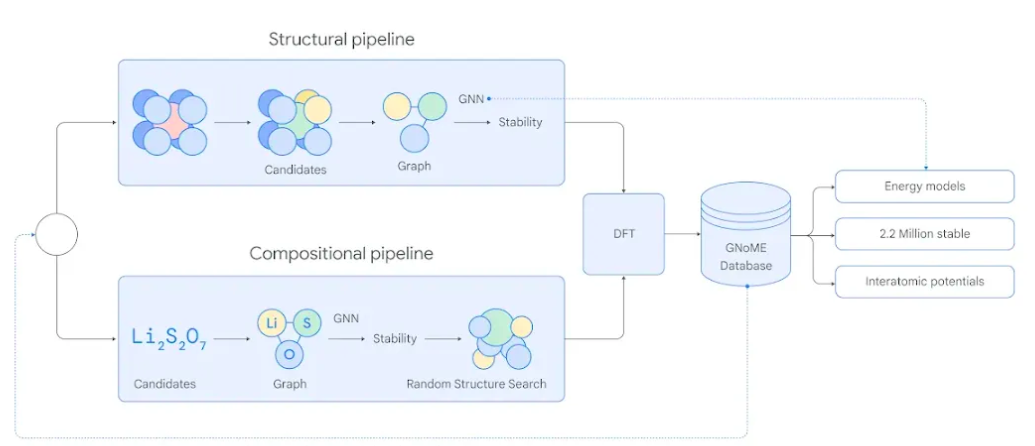
Gen AI has taken the world by storm, it's been applied to many disciplines including in pure sciences. Notably, Google Deepmind used their graph deep learning based generative AI model (GNoME) to discover millions of new materials, as well as their AlphaFold to predict the structure & interactions of all of life’s molecules.
Primary supervisor: Markus Wagner
The energy transition to net zero is in full swing! We at Monash University's Faculty of Information Technology (FIT) are in the unique position that we support the transition across an immensely broad range of topics: from model-predictive building control and community battery integration to wind farm optimisation and multi-decade investment planning, we support clever algorithms and data crunching to make decisions automatically and to let humans make informed decisions, too.
Primary supervisor: Markus Wagner
Genetic improvement (GI) of software is a family of techniques that can automatically improve code using evolutionary algorithms. The idea is to apply changes (swap lines/blocks, change + to -, etc.) to existing code until it is improved. This has been successfully deployed for automated bug fixing, speeding up existing programs, and making software more energy efficient, with impressive results.
Primary supervisor: Derry Wijaya
Islam has become the current fastest growing religion in the world. It indicates that a lot of people starting to get interested to study Islam. The best way to study a religion is by reading its holy scripture, where in Islam is the Quran. People who embrace Islam as their religion are called Muslims, and according to them it requires to sincerely open your mind and heart to study Quran, and it will take a lifetime to understand and analyze the deep meaning of Quran. Therefore, most Muslims study Quran with guidance from Muslim scholars to get better understanding of what they read.
Primary supervisor: Derry Wijaya
Despite the needs of stakeholders, which dental institutions as primary focus in this paper, the feasibility of integrating artificial intelligence (AI), specifically Language Models (LLMs), whether in a broad context or within specific environments such as dental education, is an active area of research. Studies related to AI applications, both in education or dental health institutions, suggest that ChatGPT's performance needs to be considered from various perspectives.
Primary supervisor: Derry Wijaya
The integration of chatbots into customer service operations has undergone a transformative shift across diverse industries, becoming essential instruments for delivering assistance and personalized interactions. This development, spurred by the requirement for efficient, scalable, and 24/7 available customer service solutions, has become notable in various sectors, from retail to healthcare.
Primary supervisor: Derry Wijaya
Word sense disambiguation (WSD), the process of computationally identifying the appropriate meaning of a word within its context, is a fundamental task in Natural Language Processing (NLP). Effective WSD is crucial for building accurate machine translation systems, information retrieval tools, and sentiment analysis applications, especially when dealing with diverse languages and linguistic variations.
Primary supervisor: Derry Wijaya
The Javanese language, spoken by a population of over 98 million people, faces notable challenges in digital and technological applications, especially when compared to globally recognized languages. This disparity is highlighted in several studies that discuss the lack of deep learning research benefits due to data scarcity for Javanese. Additionally, other studies have pointed out the inaccessibility of data resources and benchmarks for Javanese, contrasting with languages like English and Mandarin Chinese.